How to Make Better Decisions at Work: 12 Tools With Real Numbers
How to make better decisions at work: 12 tools, from expected value to pre-mortems, each with a worked example. Plus a free visual ebook to keep.
Published

You have two options on the table, a deadline on Friday, and a boss who will ask: "So, what do you recommend?" A feeling is not an answer. Neither is "the AI said so."
This guide gives you twelve decision making tools that turn a gut call into a choice you can explain. Each one comes from my course on decision making, and each one comes with a worked example from work and a real number, so you can see it work before you use it.
How do you make better decisions at work? Separate the decision from the outcome, then run the choice through a few simple checks: compare it with the best alternative, put a number on each option, find the guess that could flip the answer, and imagine it has already failed. You still decide. Now you can explain why.
 Tap to enlargeHow to Decide, a free visual ebook on decision making
Table of contents
- Judge the decision, not the outcome
- Add your bets up instead of judging them one by one
- Ask "compared to what?"
- Put a number on it, then ask what rate you used
- Ignore the money you already spent
- Use expected value, then check the worst case
- Draw a decision tree when you decide more than once
- Find the one guess that flips the answer
- Write the weights down before you score
- Check where the data came from
- Run a pre-mortem
- Ask "and then what?" twice
- Set a deadline when the options are even
- FAQ
Judge the decision, not the outcome
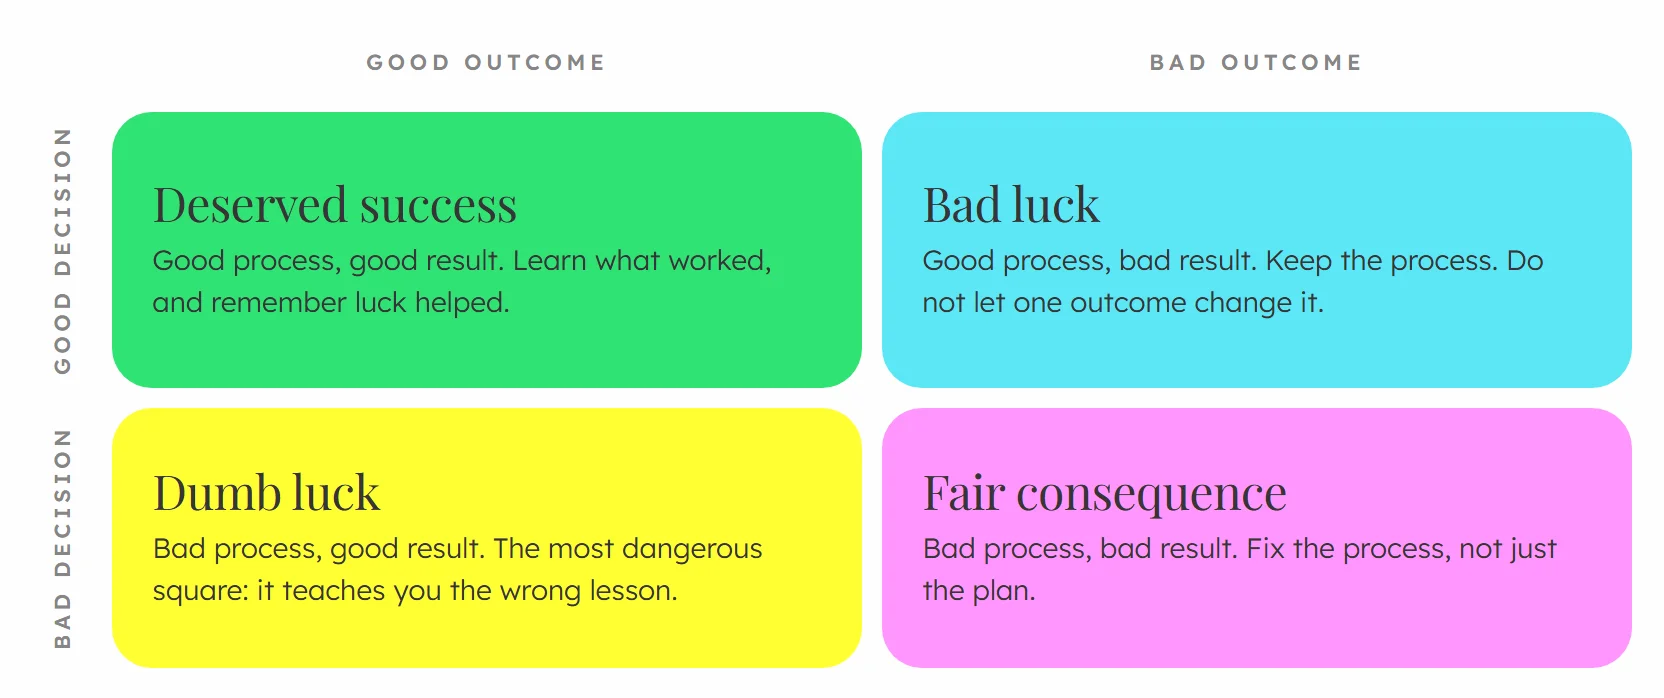 Tap to enlargeGood or bad decision against good or bad outcome: four different squares
Before any tool, one rule. A good decision can turn out badly, and a bad decision can turn out great. You control how you decide. You do not control how it ends.
Here is how far that goes. Imagine you receive ten stock tips by post, one a week, and all ten are right. The odds of that by luck are 1 in 1,024, so the sender must be good. Now look from the sender's desk: he mailed 102,400 people. Half got "up", half got "down". Every week he only wrote again to the half that saw a correct tip. After ten weeks, about 100 people hold a perfect record that came from nothing at all.
So when you look at a result, yours or anyone's, judge what was known when the decision was made. Luck happens, and some people know how to look lucky.
1. Add your bets up instead of judging them one by one
 Tap to enlargeWeigh the whole set of bets, not one at a time
A coin flip: heads you win $200, tails you lose $100. Would you take it? The economist Paul Samuelson offered this bet to a colleague, who said no. Then the colleague said he would happily take 100 of those flips.
He was right. Over 100 flips you expect to end up about $5,000 ahead, and the chance of losing money at all is about 1 in 2,300. One flip and all you see is the loss. This is narrow framing, and at work it looks like this: you judge each project on its own, each one looks risky, so you say no to all of them, when together they were a good bet.
Use it today: when you have several decisions of the same kind, put them on one page and look at what they add up to. It only works if you can afford to lose one of them.
2. Ask "compared to what?"
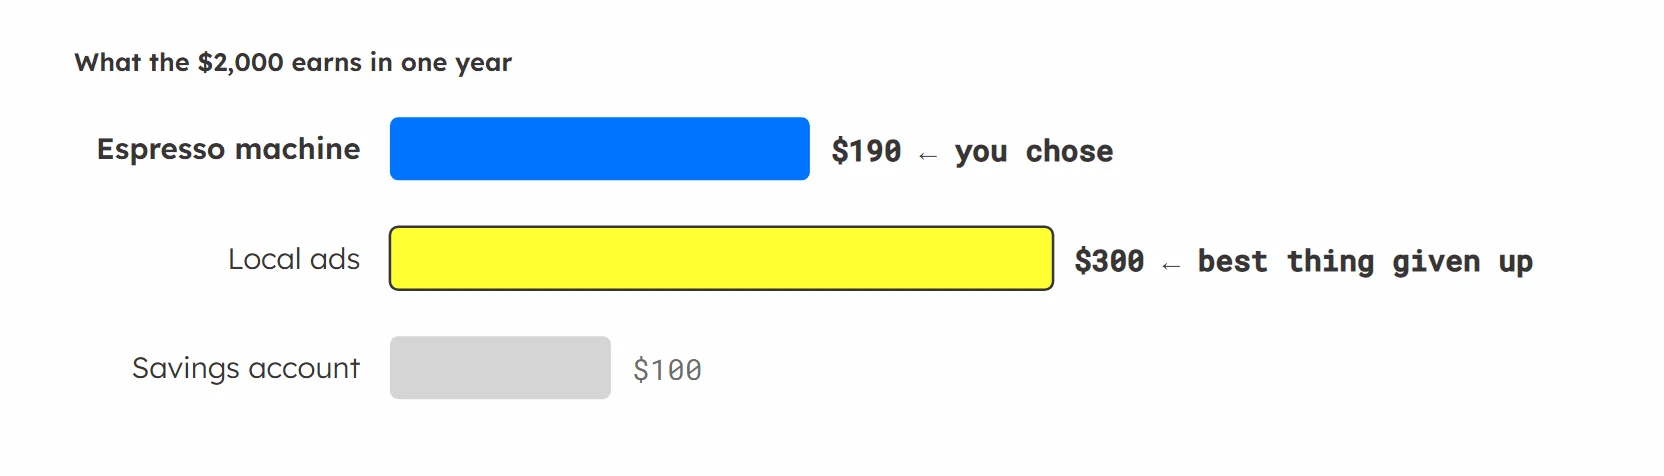 Tap to enlargeWhat $2,000 earns in a year: the espresso machine $190, local ads $300
You invest $10,000 in a project and it earns $300 this year. That is a 3% return, so it looks like a profit. But in a savings account at 5%, the same money would have earned $500. Compared to what you gave up, the project cost you $200.
That gap is the opportunity cost: the best thing you gave up to do what you did. It never shows up on a bill, which is why people forget it. And it is not only money. An hour in a meeting is an hour you did not spend on your biggest project.
Use it today: every time someone shows you a good result, ask "compared to what, exactly?" Count only the best alternative, not everything you did not do.
3. Put a number on it, then ask what rate you used
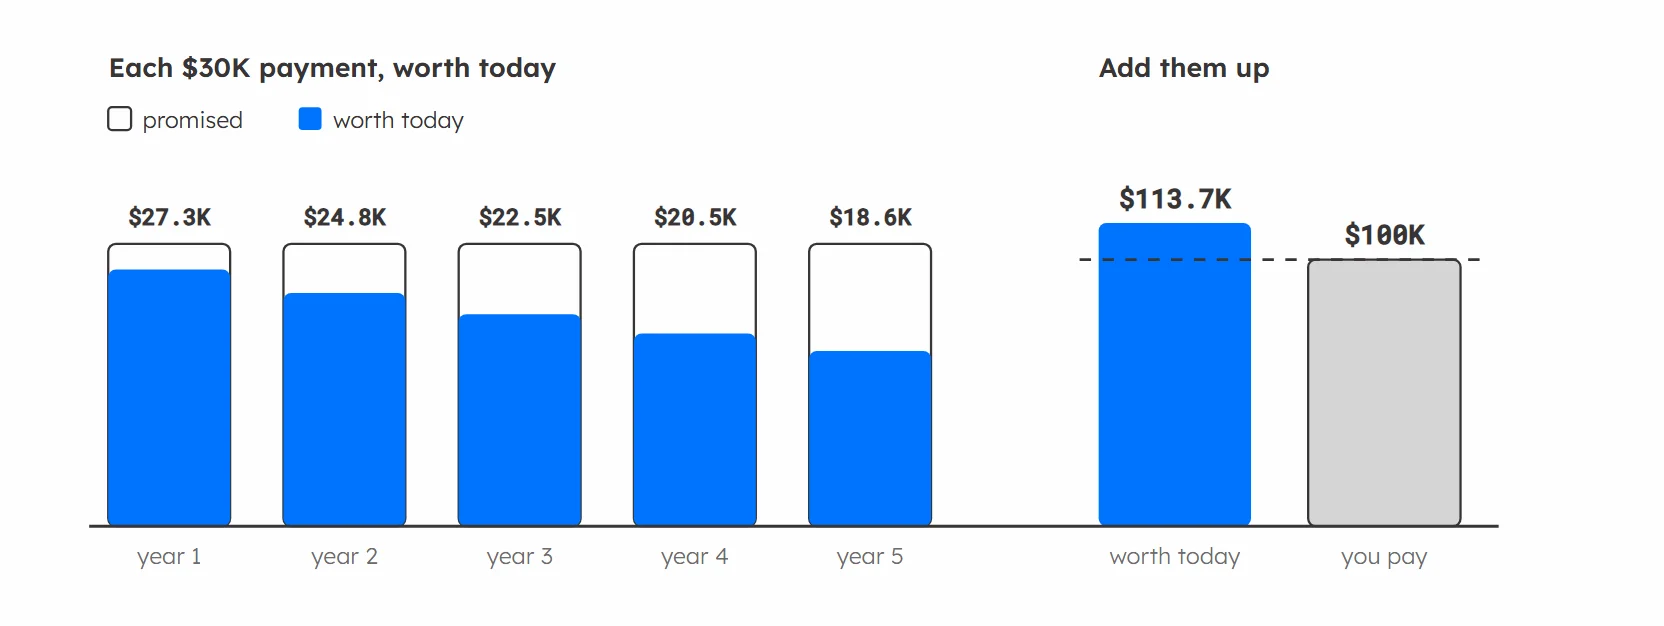 Tap to enlargeFive $30K payments are worth $113.7K today, not $150K
Return on investment tells you what you got back for what you put in: gain minus cost, divided by cost. It lets you compare projects of different sizes. A project that makes $1,000 on $2,000 (50%) beats one that makes $5,000 on $50,000 (10%), dollar for dollar.
But ROI ignores time. That is what net present value fixes. Money later is worth less than money now, so NPV turns every future payment into today's money and subtracts what you pay today.
A worked example: a project costs $100K and pays $30K a year for five years. Add it up and it looks like $50K of profit. At a 10% discount rate, those payments are worth about $113.7K today, so the NPV is about +$13.7K. Change the rate to 20% and the NPV becomes about −$10.3K. Nothing about the project changed. Only what you ask of your money.
Use it today: when someone shows you an NPV, the first question is "what rate did you use?" The second is whether you can afford to wait. Here, the $100K only comes back during year four.
4. Ignore the money you already spent
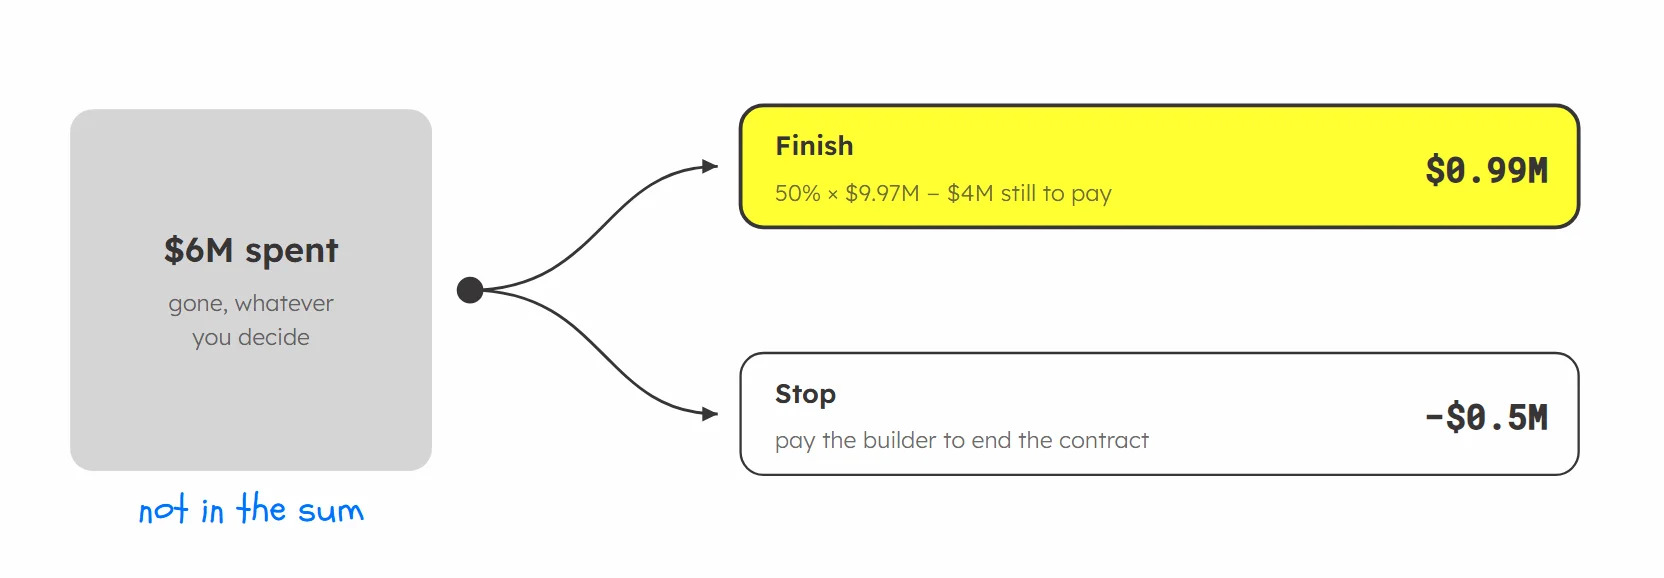 Tap to enlargeThe $6M already spent is not in the sum: finish for $0.99M, or stop for -$0.5M
You booked two ski trips for the same weekend: one cost $100, one cost $50, no refunds, and you will enjoy the $50 one more. In a 1985 study by Hal Arkes and Catherine Blumer, more than half of the people asked chose the $100 trip, the one they would enjoy less.
That is the sunk cost effect, and it is behind every "we can't stop now, we've already spent a million." The million is gone whatever you decide. It cannot be a reason to spend the next one.
In the course we run it on a warehouse: $6M already spent, $4M to finish, $0.5M to cancel the contract, and a new forecast that the cash will only be half of the plan. Finishing is still worth about $1.5M more than stopping. At 30% of the plan, stopping wins. The $6M appears in neither branch.
Use it today: ask "if we had spent nothing yet, would we start this today, knowing what we know now?" Costs of stopping, like a contract you must pay out, still count, because they are in the future.
5. Use expected value, then check the worst case
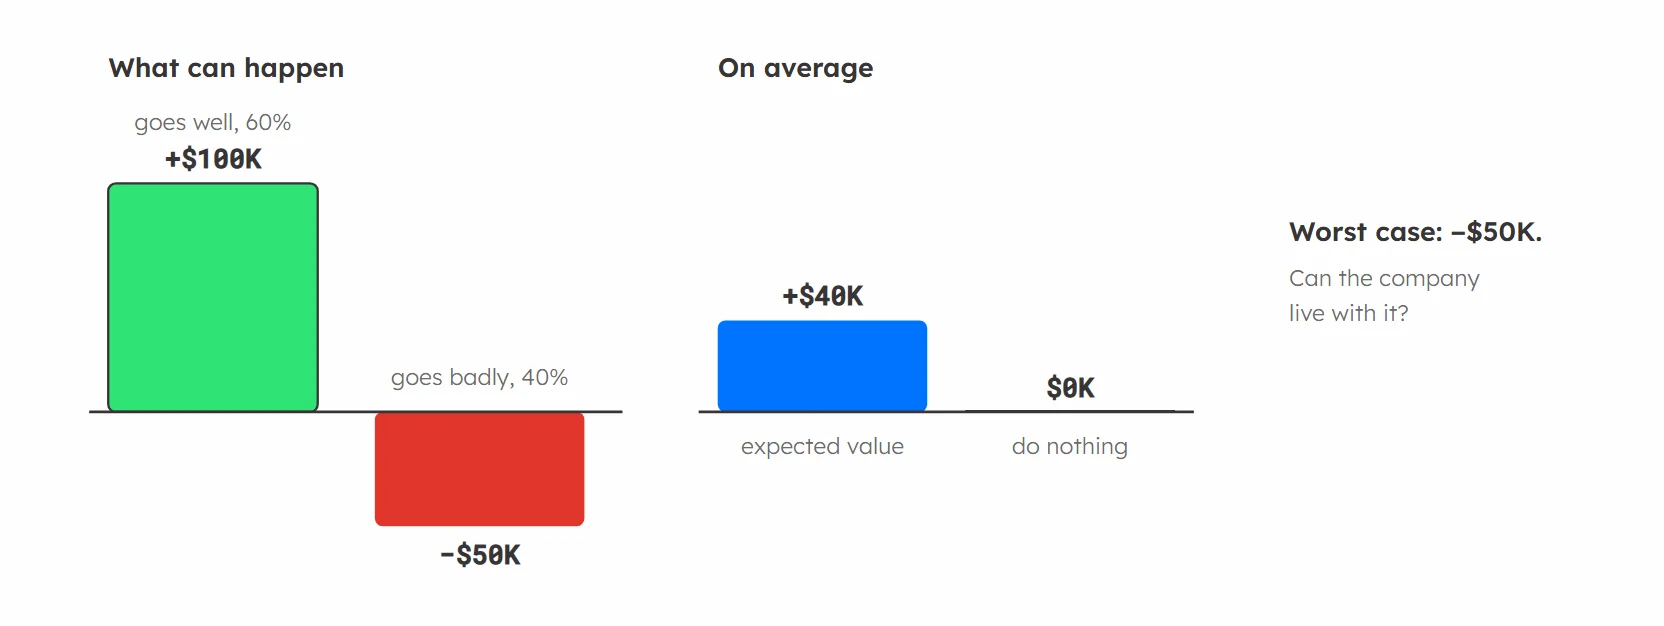 Tap to enlarge+$100K at 60% or -$50K at 40% averages +$40K, with a worst case of -$50K
Expected value is what a decision pays on average: multiply each outcome by its chance and add them up. Say you think a launch has a 60% chance of making $100K and a 40% chance of losing $50K. The expected value is 0.6 × $100K − 0.4 × $50K = $40K, and not launching is worth zero. On paper, you launch.
The hidden benefit is that you had to write down what can happen and put a number on each. Now your team argues about whether it is really 60%, not about a feeling.
The catch: expected value works when you can repeat the bet or afford to lose it. A small shop with $900 in the bank, facing a 40% chance of losing $1,000, is out of the game after one bad round, whatever the average says.
Use it today: before you trust an average, check that you could live with the worst case.
6. Draw a decision tree when you decide more than once
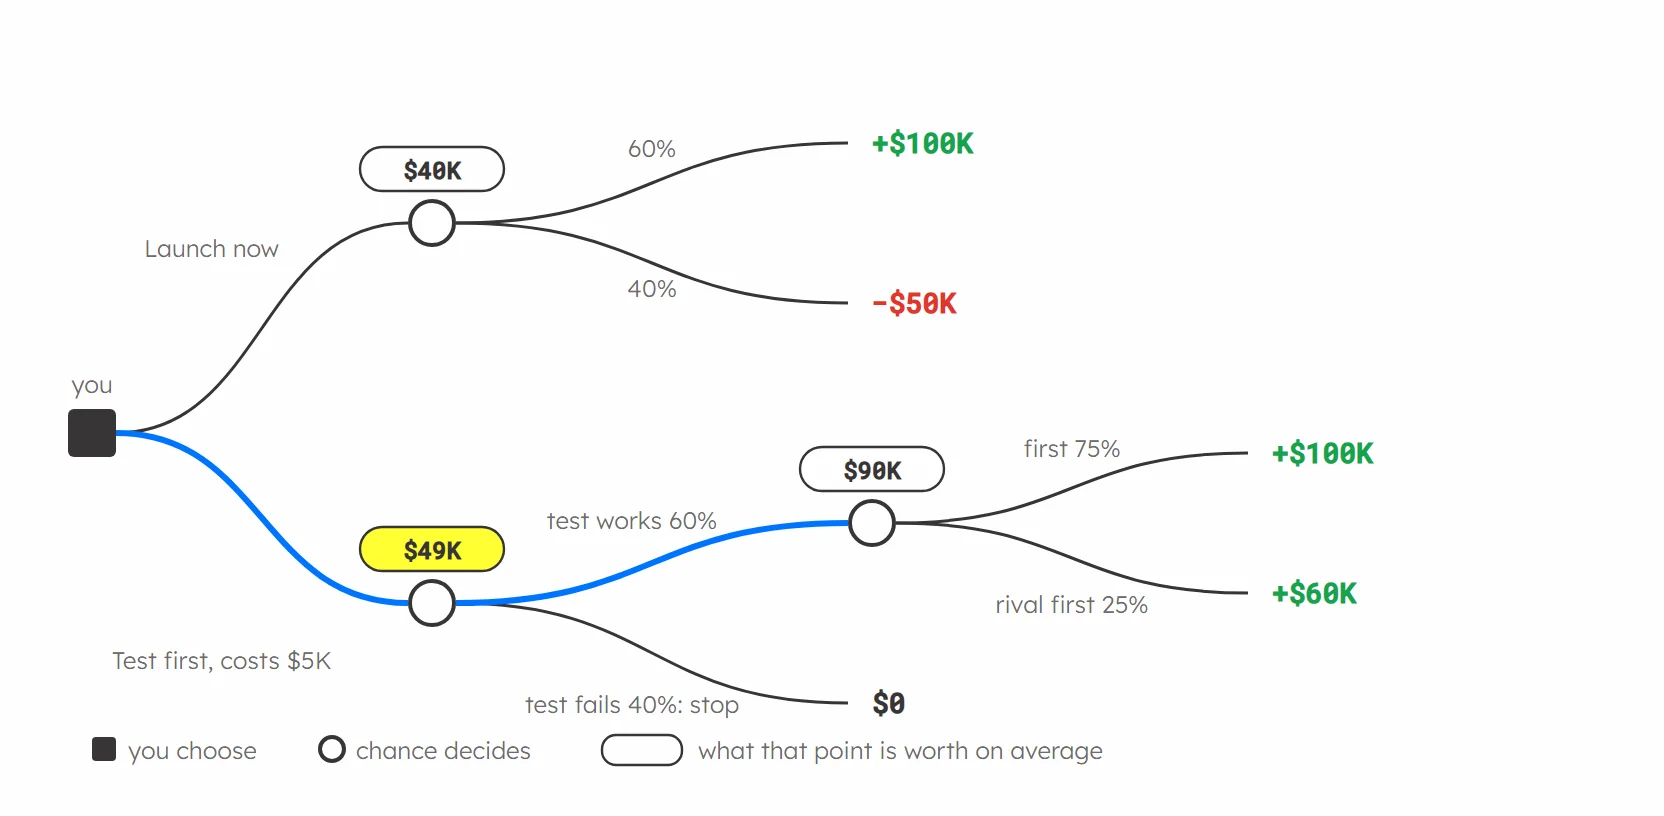 Tap to enlargeTesting first is worth $49K on average, launching now $40K
Most big decisions are not one decision. You decide, you see what happens, then you decide again. A decision tree draws that: squares are your choices, circles are chance.
Take the launch above, worth $40K. Before launching you could run a $5K test, launching only if it goes well (60%). But the test takes time, and there is a 25% chance a competitor gets in first and cuts your win to $60K. Solve the tree from right to left: after a good test, launching is worth 75% × $100K + 25% × $60K = $90K. Testing first is worth 60% × $90K − $5K = $49K, against $40K for launching now. You test.
The tree also tells you how much the test is worth: up to $14K. That is the value of information, and you get it for free from the drawing.
Use it today: a pilot, a test or simply waiting are options too. If the tree does not fit on one page, cut it to the two or three choices that matter.
7. Find the one guess that flips the answer
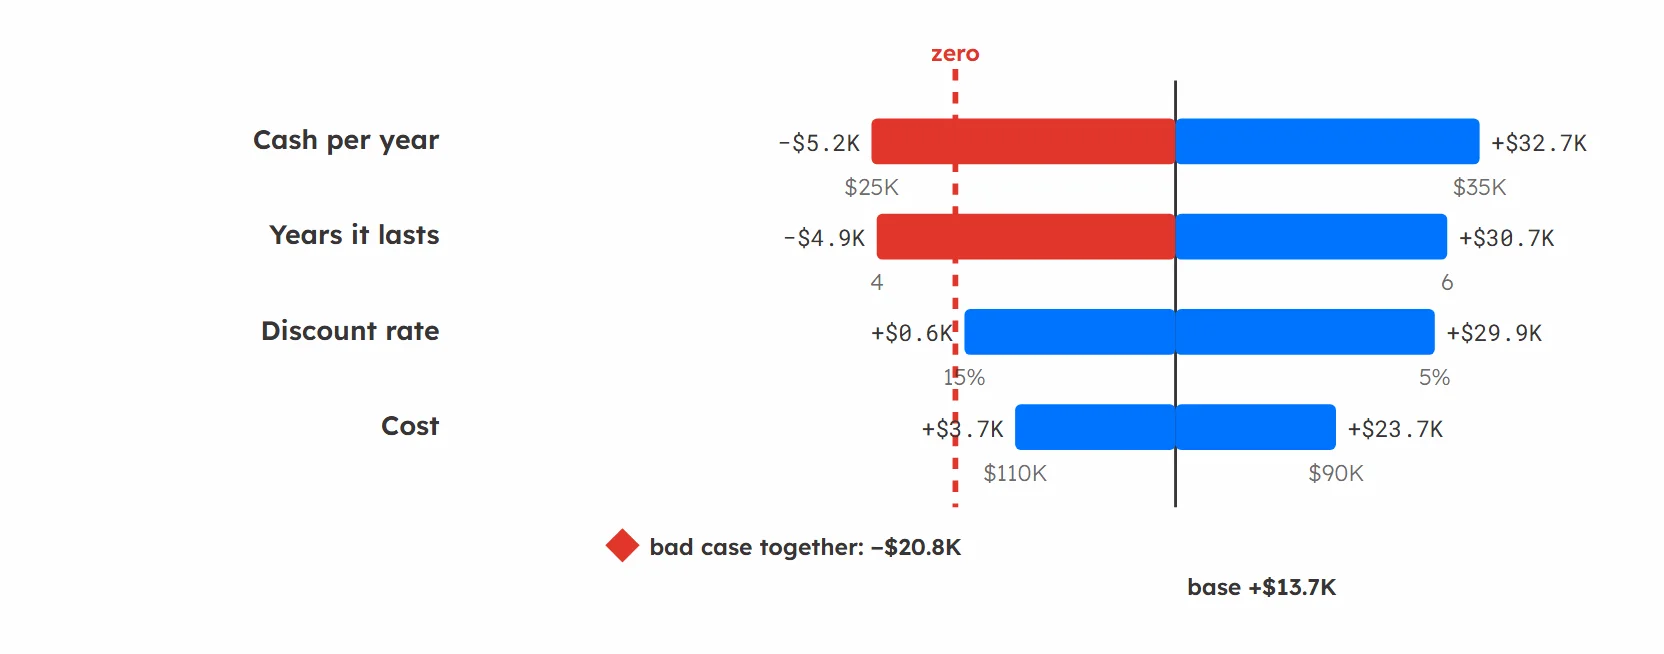 Tap to enlargeTornado chart: the guess that moves the answer most sits on top
Every NPV is built on guesses, and none of them will be exactly right. So stop asking whether the number is right. Change one guess at a time and watch what moves. That is sensitivity analysis.
Back to the $100K project. A 10% cost overrun still leaves the NPV positive. A discount rate of 15% leaves it just about positive. But $25K a year instead of $30K takes it to about −$5K, and so does a project that lasts four years instead of five. Below about $26K a year, it loses money.
Now you know where to spend your time. Do not polish the discount rate for two weeks. Go and find out whether $30K a year is real: call customers, run a test, look at similar projects. And run one bad case where things go wrong together, because they usually do.
8. Write the weights down before you score
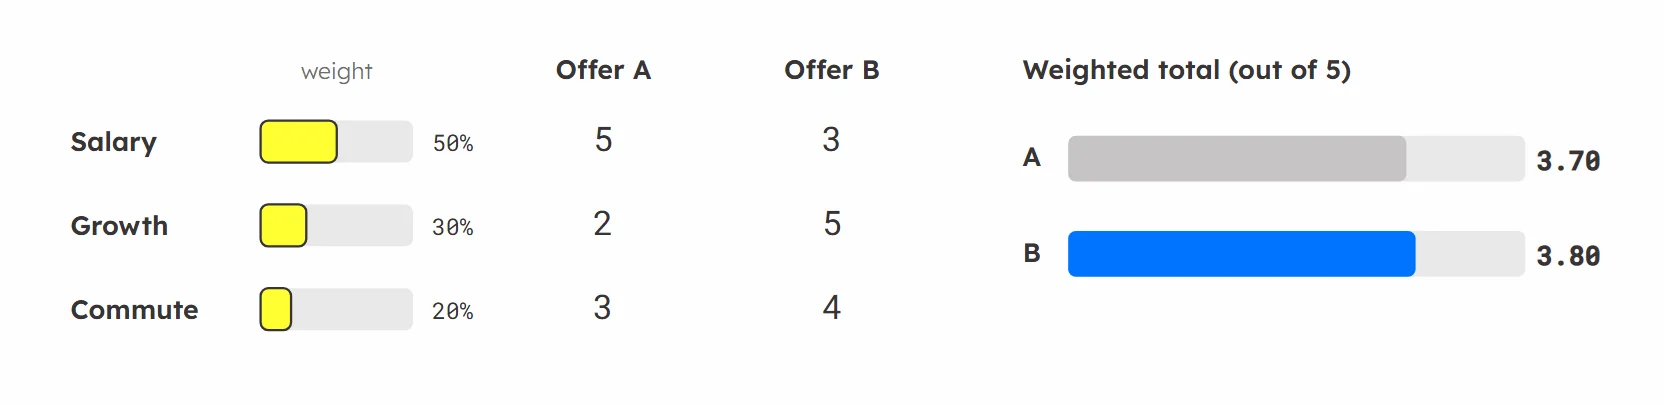 Tap to enlargeDecision matrix: weights first, then each offer's score
A decision matrix is for decisions that are not only about money. Options go one way, criteria the other, and each option gets a score. It is also the easiest tool to rig: change the weights until your favourite wins, and it looks like maths, so nobody argues.
Four steps keep it honest:
- Must-haves first. An option that fails one is out, however well it would score.
- A scale that means something. For "growth", 1 might mean the same job in five years and 5 might mean leading a team within two.
- Weights before scores. Write them down before you see a single score.
- Score and multiply.
Two job offers, weighted salary 50%, growth 30%, commute 20%: Offer A scores 5, 2 and 3 for a total of 3.7. Offer B scores 3, 5 and 4 for 3.8. B wins by 0.1, which is close, and that is worth knowing too. A matrix does not make the decision. It shows what the decision depends on.
9. Check where the data came from
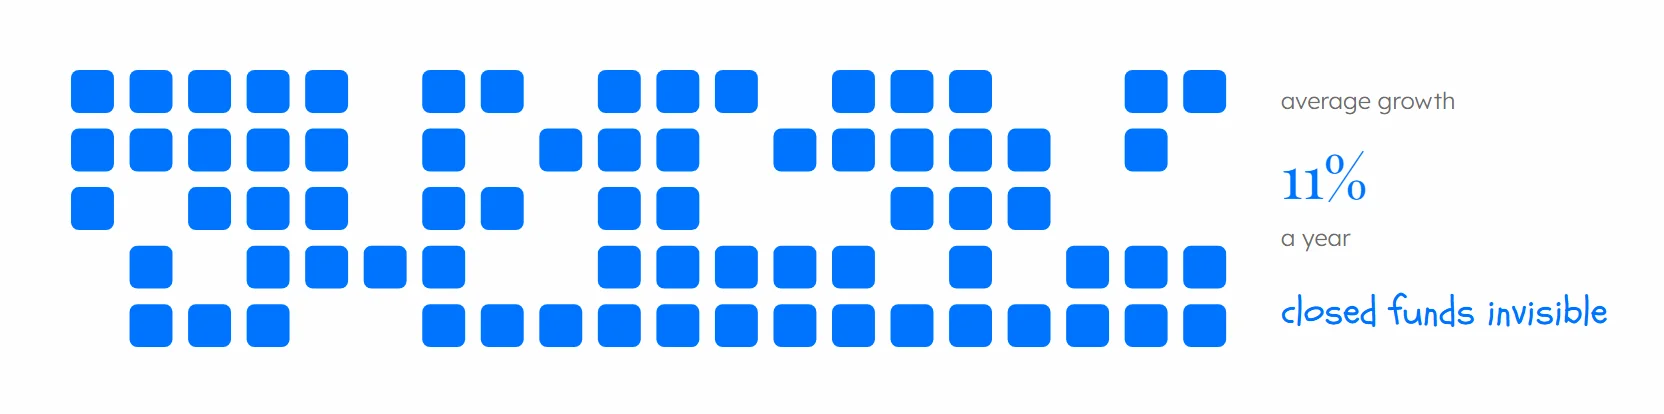 Tap to enlargeAverage growth looks like 11% a year because the closed funds are invisible
Two biases hide in almost every report you will read.
Survivorship bias. In 2004, Morningstar reported that its funds had grown 11% a year over the previous decade. But funds that perform badly get closed, and closed funds drop out of the list. Put them back in and growth falls to about 9% a year.
Selection bias. Do top universities make people successful, or do they pick people who would succeed anyway? Stacy Dale and Alan Krueger compared students who attended a top school with students who were admitted but went elsewhere. On average the earnings were about the same, except for students from low-income families.
Use it today: ask "does this include the failures?" and "how was this group chosen?"
10. Run a pre-mortem
 Tap to enlargeFind the trap before you walk into it
Ask a team "how do we make this a success?" and you get "great marketing, a good website, happy customers." All true, nothing to act on. Now ask: "It is a year from now and this failed completely. Why?" You get "our only developer quit", "nobody checked if customers would pay that price", "the delivery partner could not cope." Each one is fixable today.
That is inversion, and the team version is the pre-mortem, described by the psychologist Gary Klein in Harvard Business Review. One meeting:
- Everyone hears the plan.
- Imagine it is a year later and the project has failed.
- Everyone writes the reasons alone, in silence, for a few minutes, so nobody copies the boss.
- Go round the room, one reason each, until the list is done.
- Pick the biggest ones and change the plan.
It is cheap, and it fixes a real problem: once a plan is moving, people with doubts stop saying them. In a pre-mortem, finding the problem is the job.
11. Ask "and then what?" twice
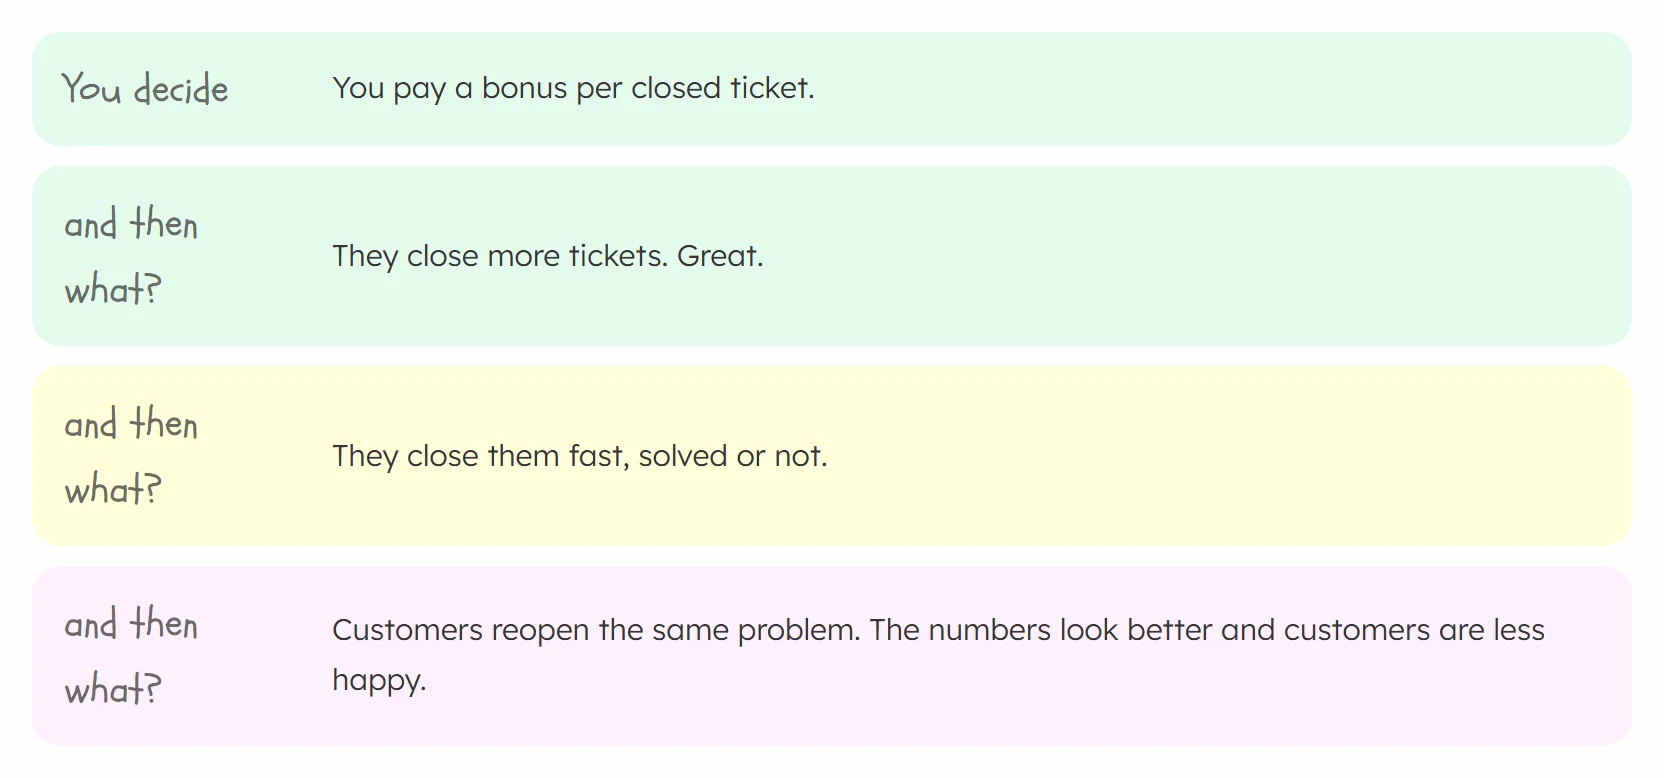 Tap to enlargeA bonus per closed ticket, followed three steps on
In 1998, ten daycare centres in Haifa had a problem with parents picking their children up late. Six of them introduced a small fine. Late pickups went up, to almost twice as many, and stayed there after the fine was removed. The fine turned a favour into a service you could pay for.
The first effect of a decision is rarely the whole story. Pay your support team a bonus per closed ticket, and then what? They close more tickets. And then what? They close them fast, solved or not. And then what? Customers reopen the same problem, and your numbers look better while your customers get less happy.
Use it today: before a change, write down what happens next and ask "and then what?" at least twice. Stop at two or three steps; after that you are mostly guessing.
12. Set a deadline when the options are even
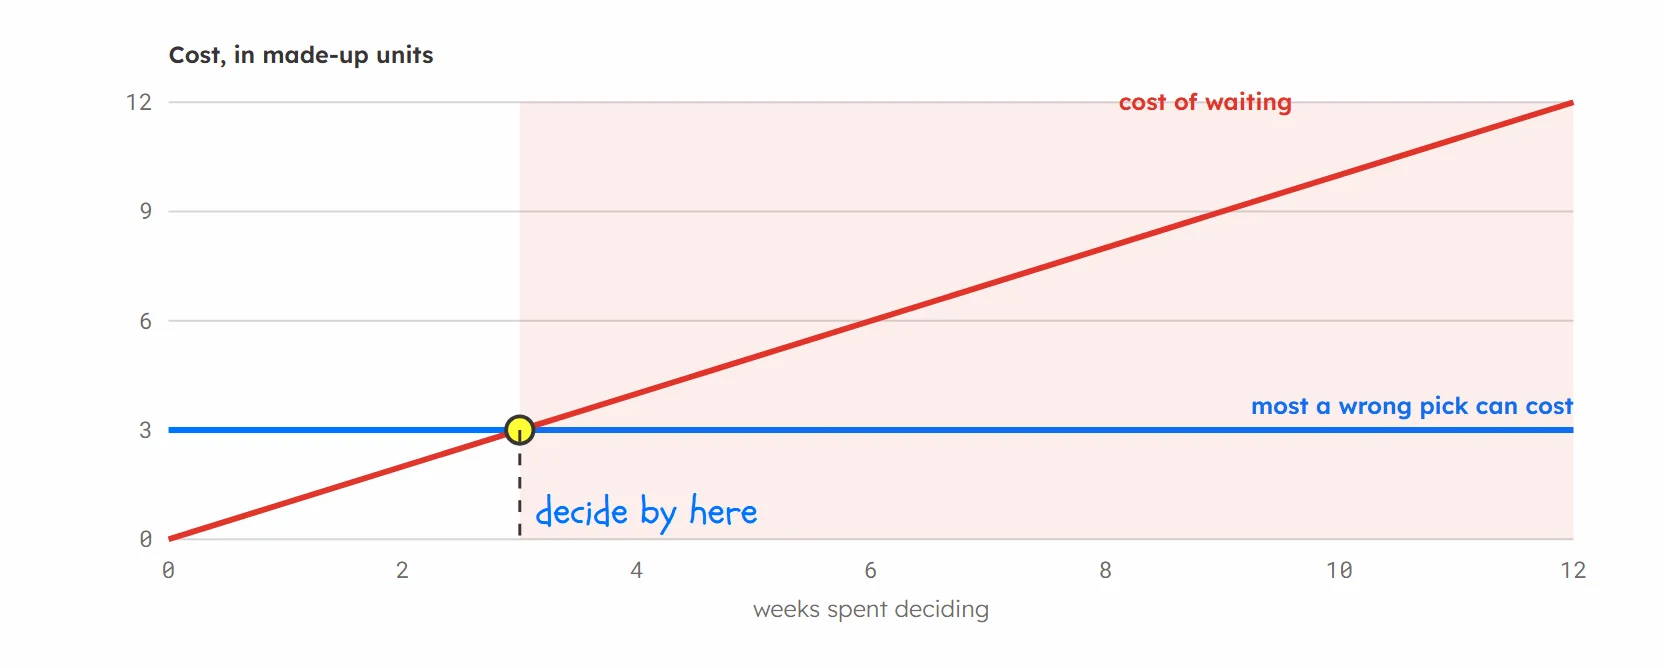 Tap to enlargePast a point, the cost of waiting is bigger than the cost of a wrong pick
Your team has compared two suppliers for six weeks. The spreadsheet has 40 rows and they come out about even, so someone asks for one more quote and one more meeting. If two options are really that close, picking the wrong one costs little, and waiting costs you every week.
Use it today: when you have done the work and the options are still about even, set a deadline and pick one, even if you flip a coin. Two checks first: make sure you really looked closely, and give more time to a decision that is hard to undo.
See every tool working
I turned all of this into a free visual ebook, How to Decide: 36 ideas, from narrow framing to Buridan's donkey, each with a figure you can drag, click and rerun. The stockbroker's letters halve on screen, the decision tree recalculates as you move the odds, and the decision matrix shows you exactly how easy it is to rig.
If you want to practise each tool on real cases, with exercises in Excel or Google Sheets and a capstone project, that is my Decision Making and Problem Solving course. It includes the Amazon warehouse in Antarctica case, where you decide if a $10M project with an NPV of about −$30K should go ahead.
Prefer to start free? The Decision Making crash course covers the basics in one sitting.
Decision making at work: FAQ
What are the steps of good decision making at work?
Frame the decision, list more than two options, put a number on each one where you can, find the guess that could change the answer, check the worst case, and imagine the plan has failed. Then decide, and judge the decision later by what you knew at the time.
What is the best decision making tool?
There is no single best one. Use expected value when outcomes are uncertain, a decision tree when you decide in stages, NPV when money arrives over time, and a decision matrix when the answer is not only about money.
How do cognitive biases affect decisions at work?
They make you see patterns that are not there and feel sure about them. Confirmation bias filters the evidence, anchoring pulls estimates toward the first number, and sunk cost keeps failing projects alive. Knowing a bias does not make you immune, but it tells you which question to ask.
How can I make decisions faster without making worse ones?
Decide in advance what "good enough" looks like, use a matrix with weights written down first, and set a deadline. When two options are close, waiting usually costs more than choosing the slightly worse one.
Can AI make business decisions for me?
AI can give you ten options in ten seconds and check your maths. Picking one, defending it and living with the result is still your job.
About the author
Diogo Alves de Resende is a data scientist, AI educator, and the founder of The Data Hero. He helps career switchers and working professionals break into data and AI through hands-on courses, ebooks, and the Hero Program. Connect on LinkedIn or book a strategy call.